Curious about how temperatures change in everyday environments like freezers, roofs, or even water pipes? Over time, data collected with iSocket Historical Temperature Data (HTD) has helped understand these changes better, whether for scientific research, practical needs, or just curiosity.
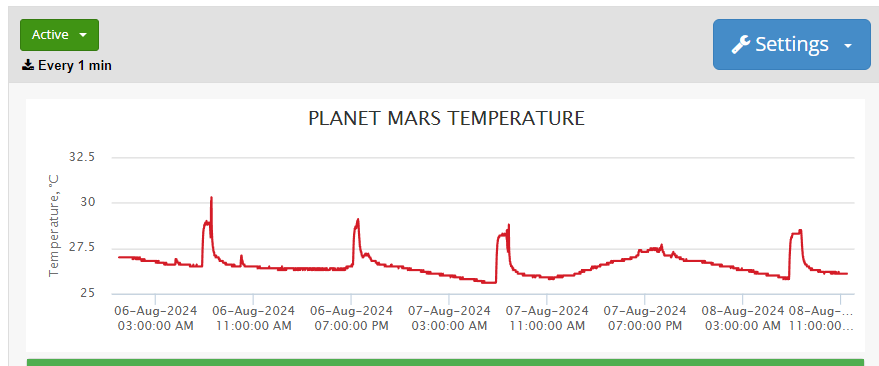
Today, you’re going to see some unique content that you won’t find anywhere else! In this article and related posts (I will link them all), I’m going to show you the temperature profiles of various things I’ve been measuring. I enjoy measuring temperatures everywhere. We’ll explore the temperature behavior of multiple environments using the iSocket Historical Temperature Data (HTD) feature. I’ve collected a lot of temperature profiles over time, and we’ll review them all. We’ll look at the data I’ve gathered over the past year—or even a couple of years—and evaluate it. You’ll see a ton of applications, and I will cover the HTD feature in detail.
This article and the linked ones are a kind of lighthearted representation of the information I presented in my one-hour YouTube video that covers this topic entirely. You can find that video at the end of each article.
For me, it’s a research interest, but it’s not just about curiosity. In some cases, I really need to know the temperature of different items and receive notifications about temperature changes, such as rises or drops, to detect problems like frozen pipes or a non-working fridge. One time, it really helped me because the freezer displayed -18°C, but I received notifications, and it turned out the freezer was broken.
Let’s dive in and analyze each of these profiles, starting with quite common applications—freezers and fridges. I will occasionally switch between Celsius and Fahrenheit, but mostly I will use Celsius.
1. Freezer Temperature Monitoring
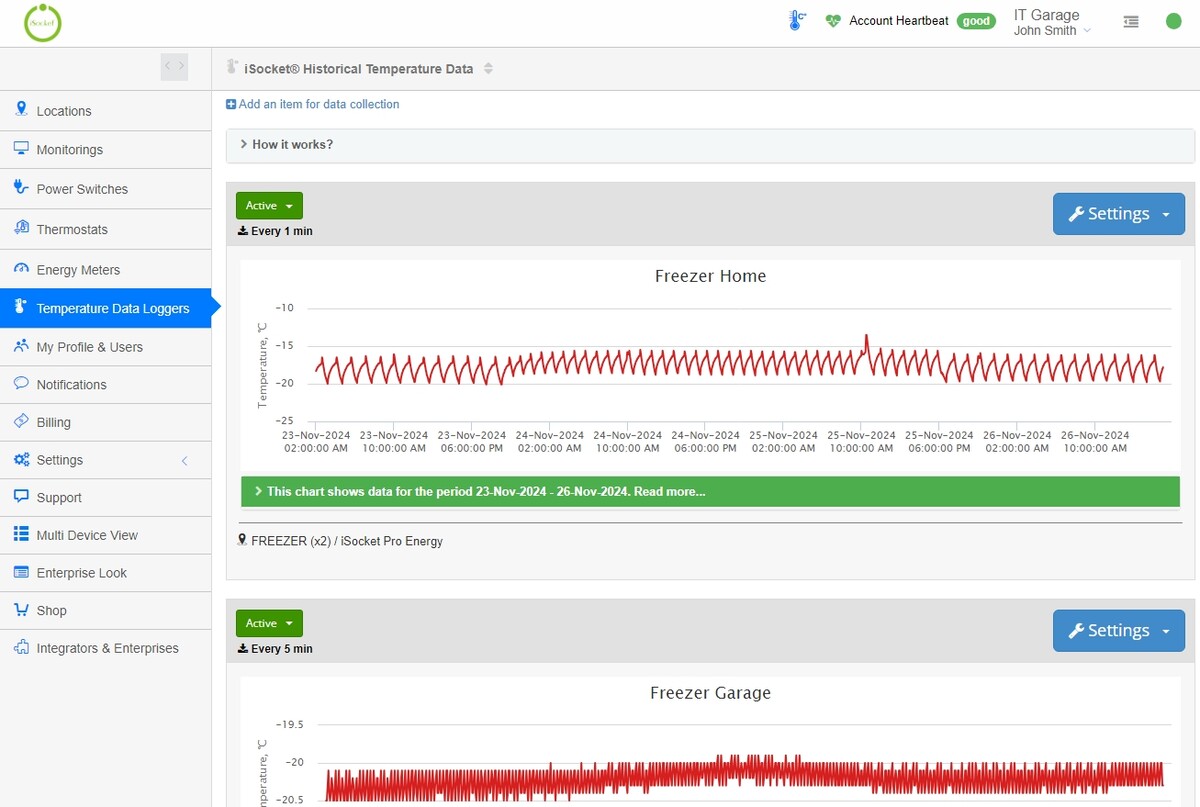
Let's start with freezer monitoring. The sensor I've placed inside my home freezer helps me track its internal temperature. For some applications like vaccine storage monitoring it's important to monitor the actual temperature inside the freezer, not just the displayed temperature. Often, freezers show a "fake" temperature on the display, which doesn’t necessarily reflect the true temperature inside. For example, if the freezer is set to -18°C (0F), the sensor placed inside can show a higher temperature, like -15°C (5F), when the compressor is not running.
“ These temperature profiles have helped me troubleshoot freezer issues in the past and even allowed me to detect a failed freezer while the display showed a normal temperature”.
I used to think that when I saw the temperature rise to -15°C (5F) or higher, it was a problem. But, as I learned, this can happen when the compressor stops working for a short period or when the freezer door is opened. By placing the sensor closer to the door, I can observe more fluctuations.
In my case, I set up notifications when the temperature exceeds -13°C (8.6F), as this is when it’s a sign that something might be wrong. If the freezer’s internal temperature reaches -12°C (10.4F), I know it’s time to investigate the situation further. These temperature profiles have helped me troubleshoot freezer issues in the past and even allowed me to detect a failed freezer while the display showed a normal temperature.
2. Monitoring Temperature Changes on the Roof for Solar Panels
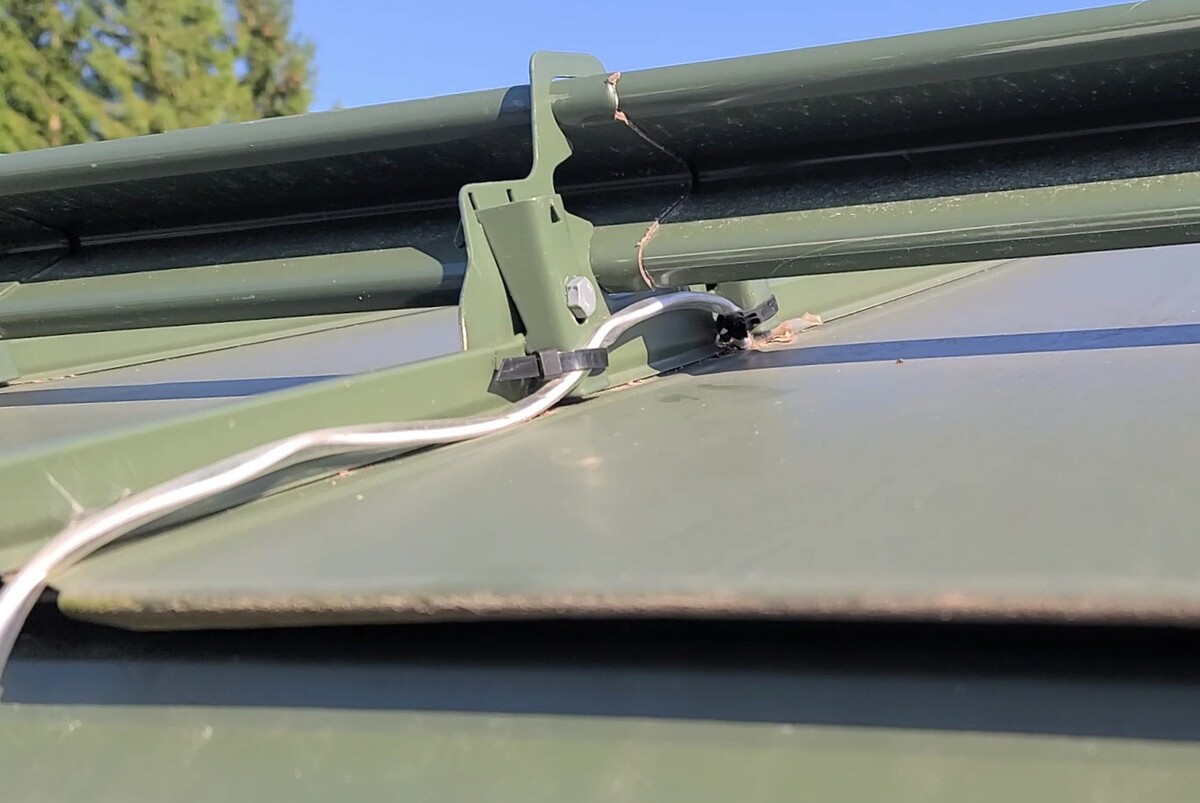
The roof temperature is another critical monitoring point, especially since I’m working on a solar panel project. When evaluating solar panel efficiency, knowing the roof temperature is essential because it impacts the panels’ performance. Most solar panels are rated for temperatures up to 85°C (185F). My roof temperature data showed that the temperature reached around 50°C (122F) during sunny days, which is within an acceptable range for solar panels. However, it’s still good to monitor these peaks to ensure the panels aren’t overheating.
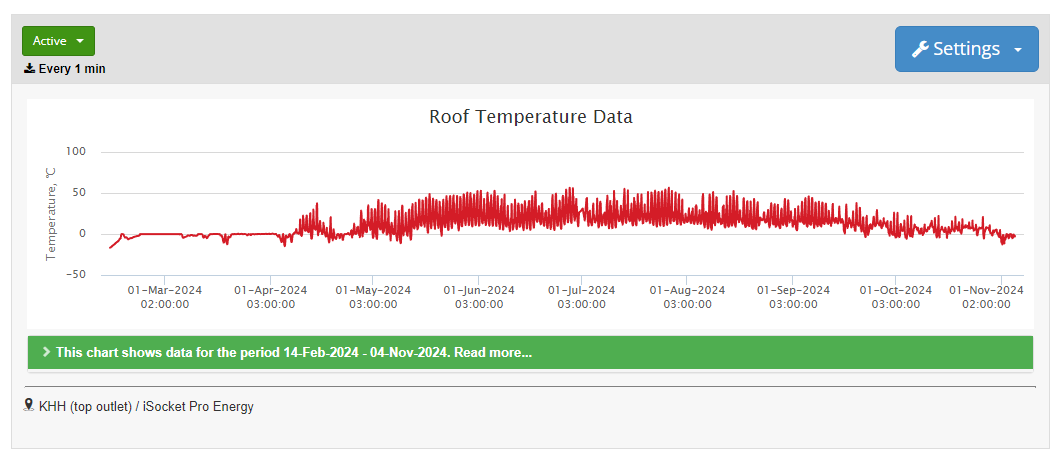
I selected data from March to November. As we can see, the period from May to September had higher sun exposure, and I observed how the roof temperature fluctuated. During this time, I saw temperatures as high as 55°C (130F), but since the panels are rated for higher temperatures, this was still within a safe margin. So, it’s safe to install solar panels on this roof in my location.
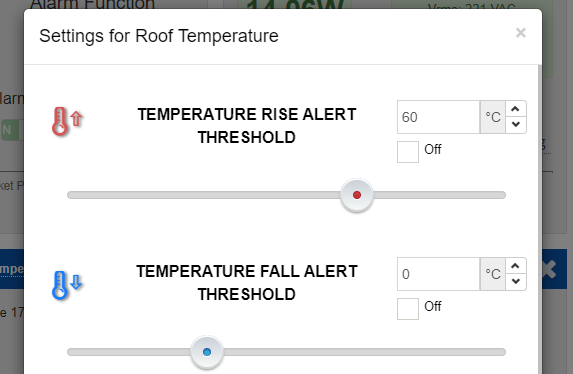
I decided to adjust the temperature alerts on the roof to track if it ever exceeds 60°C (140F), allowing me to monitor any potential heat buildup. Tracking roof temperature not only helps evaluate solar panel performance but also ensures the system operates within safe limits.
I covered this and related topics in more detail in my article about environment temperature monitoring.
3. Analyzing Water Drainage Temperature for Pipe Freezing
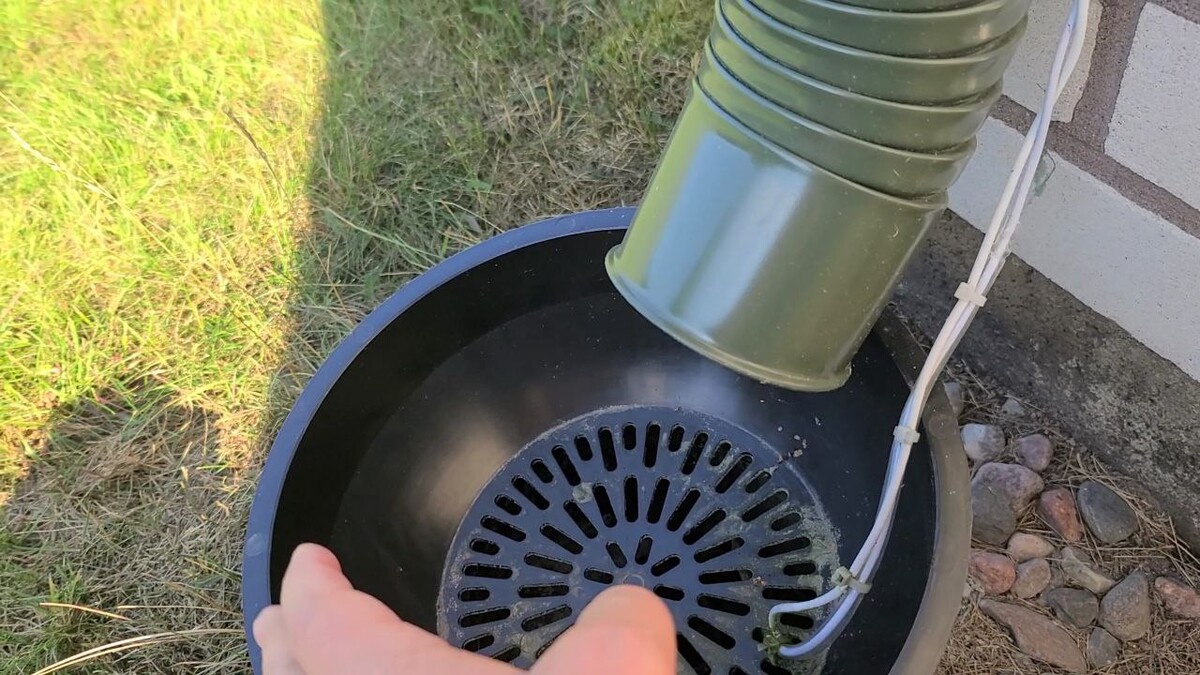
Moving on to another practical use, I’ve been monitoring the temperature inside pipes buried underground to prevent freezing. The ground temperature fluctuates seasonally, and with the data from the sensor, I can track when temperatures approach freezing levels.

During the coldest periods, the sensor readings show the ground temperature dropping to 0°C, while the roof temperature is usually a bit warmer due to the snow cover. This demonstrates how different environments can influence temperatures in unexpected ways, and it’s crucial to monitor them to prevent issues like pipe freezing.
I covered this and related topics in more detail in my article about environment temperature monitoring.
4. Temperature Monitoring in Premises Heated by Air Pumps
The temperature inside premises heated by an air pump can be quite chaotic. When the pump blows air, you’ll notice a rise in temperature, but your air pump itself won’t display this. To monitor the temperature in the garage, which is heated by an air conditioner, I’ve installed the iSocket along with the iSocket Temperature Sensor Specific at the top of the ceiling.
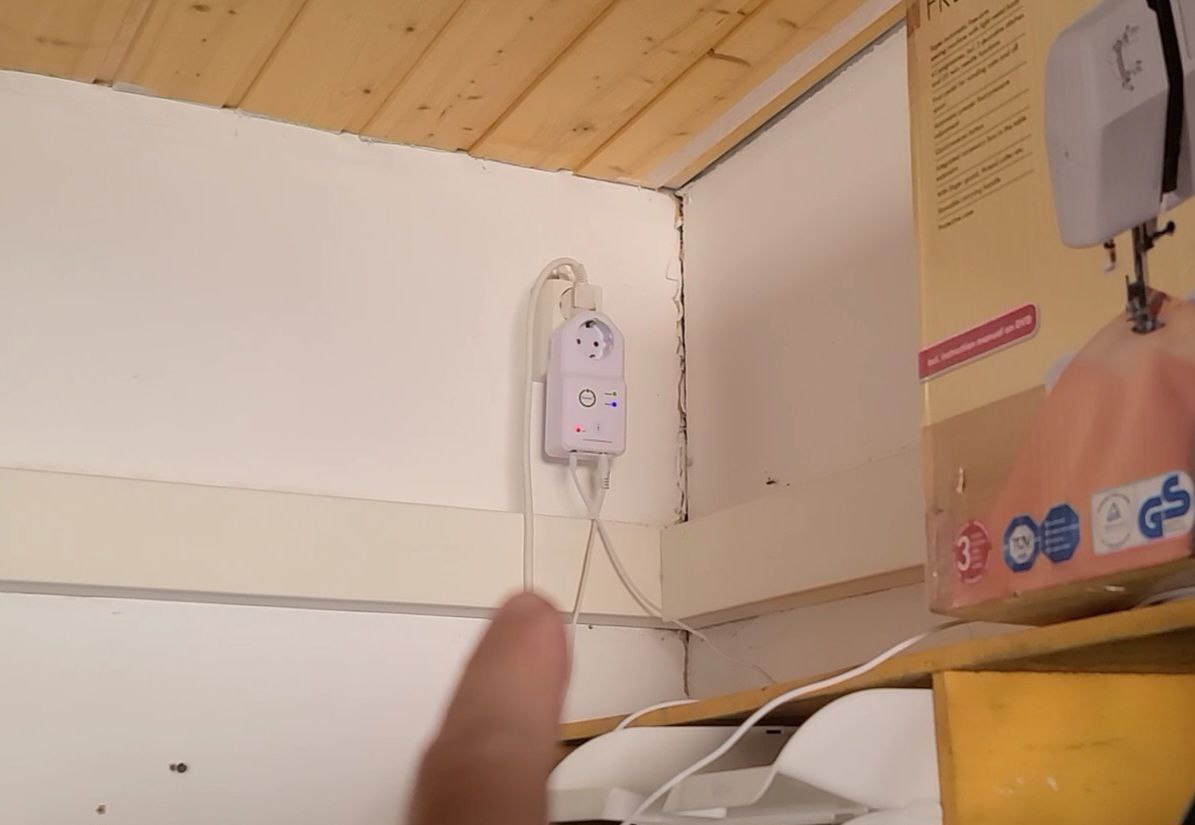
You can see that the temperature profile here is quite chaotic. Unlike a fridge or freezer, it doesn’t follow a set pattern.
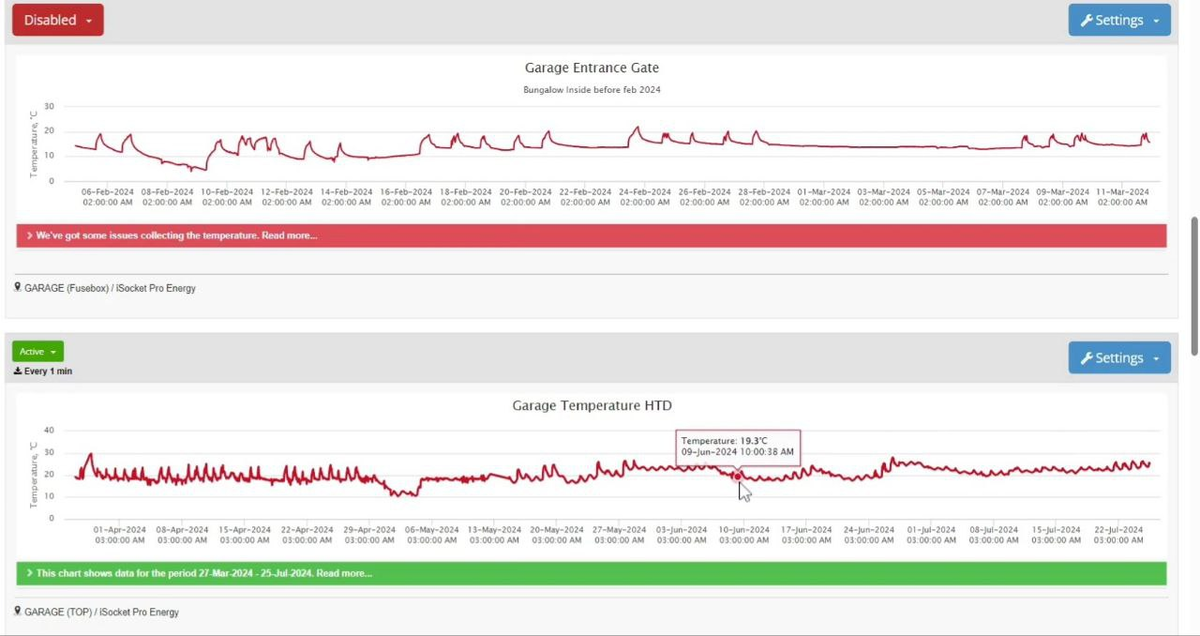
The temperature rises and falls based on various factors, such as the position of the sun, changing outdoor weather conditions, and the operation of the air pump—whether it’s running and how intensively it blows. Once again, this temperature fluctuation won’t be visible on your air pump or HVAC system; it can only be observed with accurate temperature measurements from the iSocket sensor. It’s crucial to place the sensor in the right location if you want to avoid these fluctuations.
5. Keep Your Computer and Your Eyes Healthy
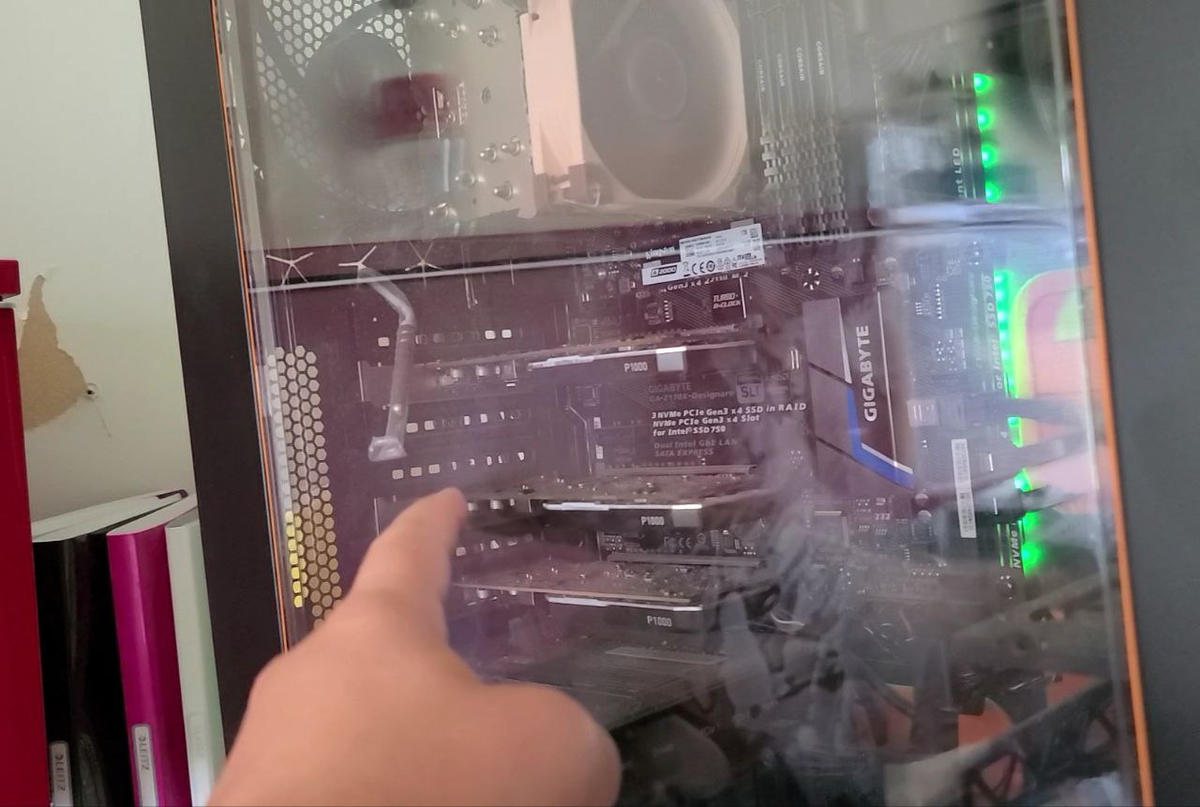
Now, let’s dive into something interesting: the temperature sensor inside the computer case. I placed the sensor inside the PC to monitor its internal temperature—whether it’s hot or cool. I also installed another sensor behind the monitors to track the heat they generate, as it can affect eye health over time.
As seen on the HTD chart below, the temperature inside the computer has ranged from 30°C to 32°C in July, which is roughly the same as the temperature outside the computer. Looking at a longer period, such as from March when the outdoor temperature was cooler, you can observe some drops in the internal temperature. There are also noticeable drops, likely when the computer was turned off, with the temperature falling to around 22°C, similar to typical room temperature. When the computer was running, the temperature increased again, as expected. However, the readings appear to be chaotic, without any clear pattern.
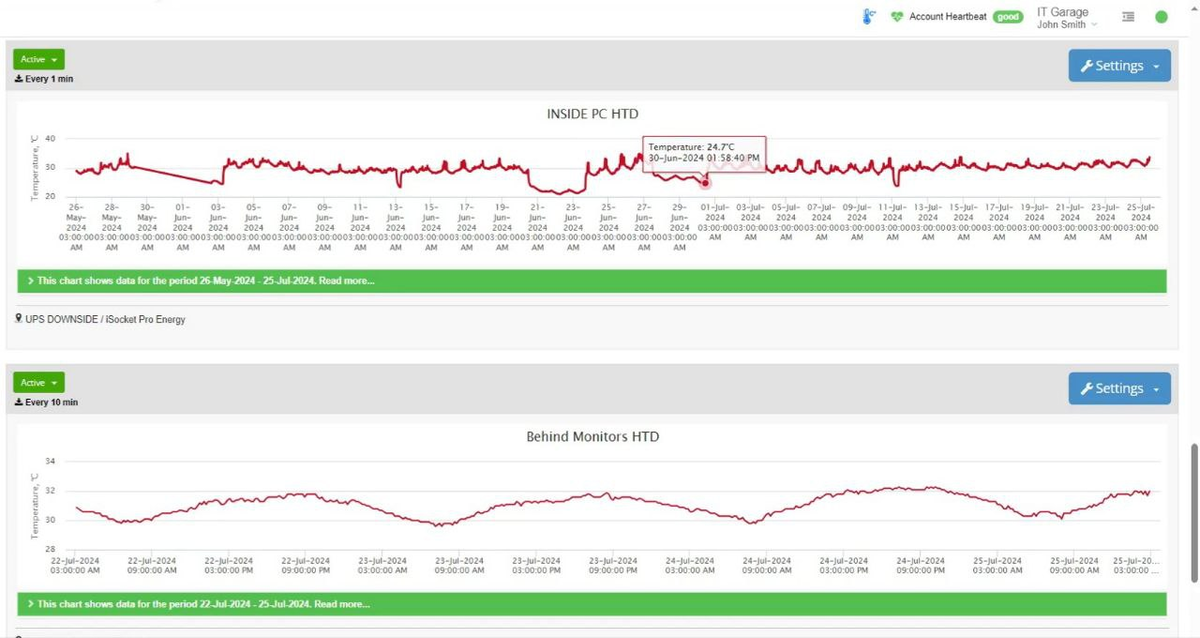
Next, let's take a look at the sensor placed behind the monitors to see how much heat is being directed toward my eyes. The chart above displays temperature data collected over three days. As you can see, the temperature changes are subtle, with minimal fluctuations, which is typical in a stable environment with little external influence. By the way, I prefer to use monitors with an external power supply, as they generate less heat.
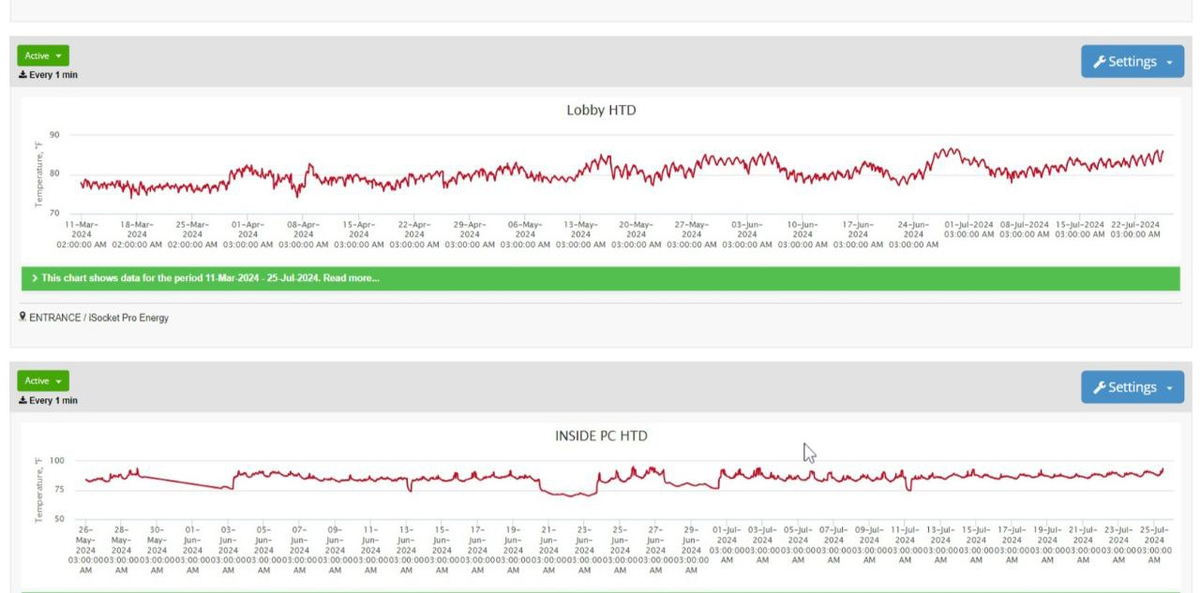
Below, you will find the inside PC temperature chart in Fahrenheit, along with the lobby temperature data.
Conclusion: The Importance of Temperature Monitoring
Guys, I've reviewed only 5 examples, but as promised, there are plenty more to come. Yes, I plan to cover more in upcoming articles, but for now, you can watch my video below and find timecodes for the specific topics on temperature data collection that interest you. Monitoring temperature over time provides valuable insights into the health and performance of various systems. Tracking temperature fluctuations helps diagnose issues early, prevents damage, and boosts appliance efficiency. Whether it’s monitoring roof temperatures for solar efficiency or tracking freezers to detect failures, these temperature profiles offer crucial data for making informed decisions. As I continue refining my monitoring setups, I’ll keep sharing the findings and insights.
