Exploring temperature data is an exciting journey, whether monitoring outdoor conditions, water temperatures, or even small fluctuations in a room. In this post, we dive into the value of collecting and interpreting real-time temperature profiles using iSocket sensors. Learn how these readings can reveal insights into everything from HVAC performance to the behavior of natural environments.
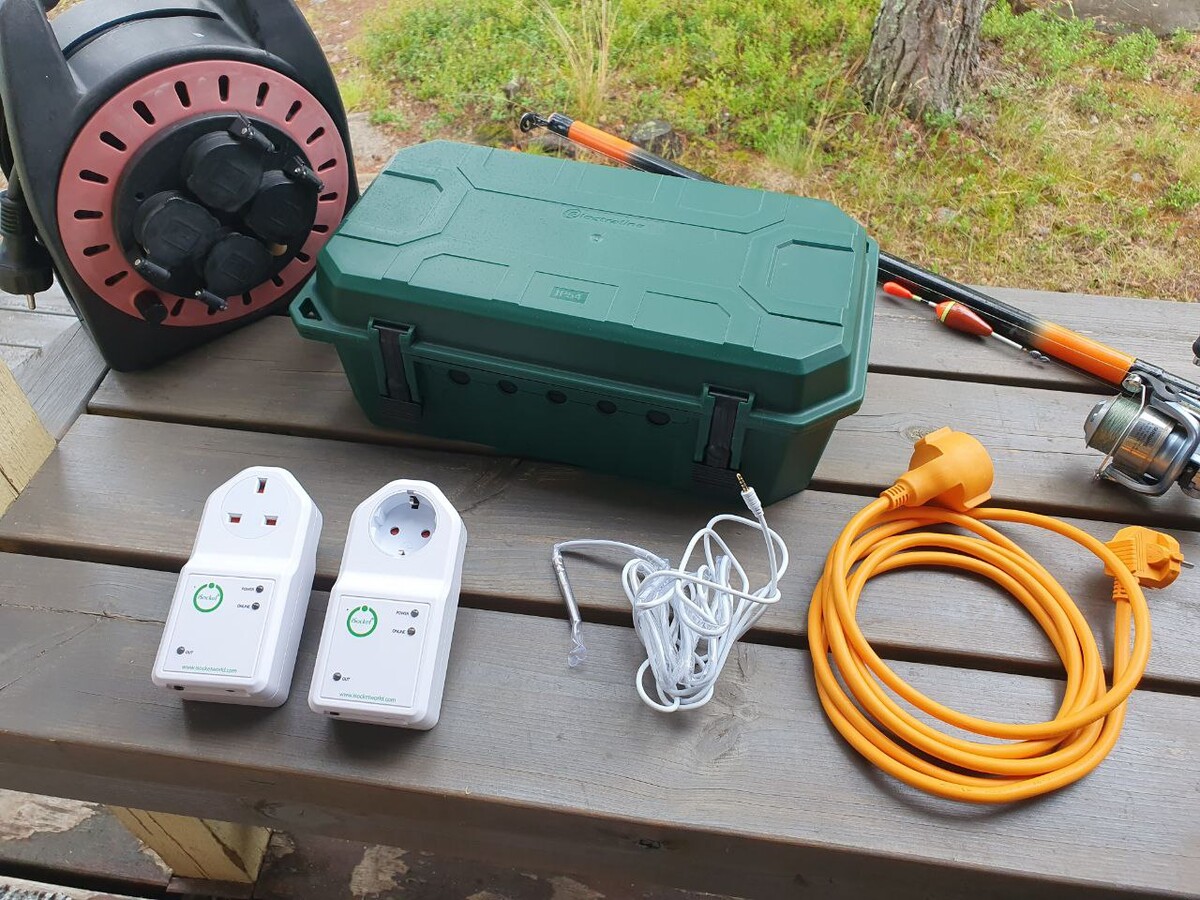
I’m an enthusiast when it comes to exploring temperature variations across different environments. In my first article on this topic, I covered five applications of the iSocket Historical Temperature Data (HTD) feature. Now, in this concluding article, I’ll focus primarily on how I used the iSocket Temperature Sensor Specific to monitor outdoor temperatures in various locations.
I’d like to remind you that these articles are essentially summaries of my video, where I consolidated information about all the applications of iSocket Temperature Data Loggers. Because of this, the writing style may occasionally feel like a transcript of the video. You’ll find the video itself at the end of this article.
Lake Water Temperature Data in Finland
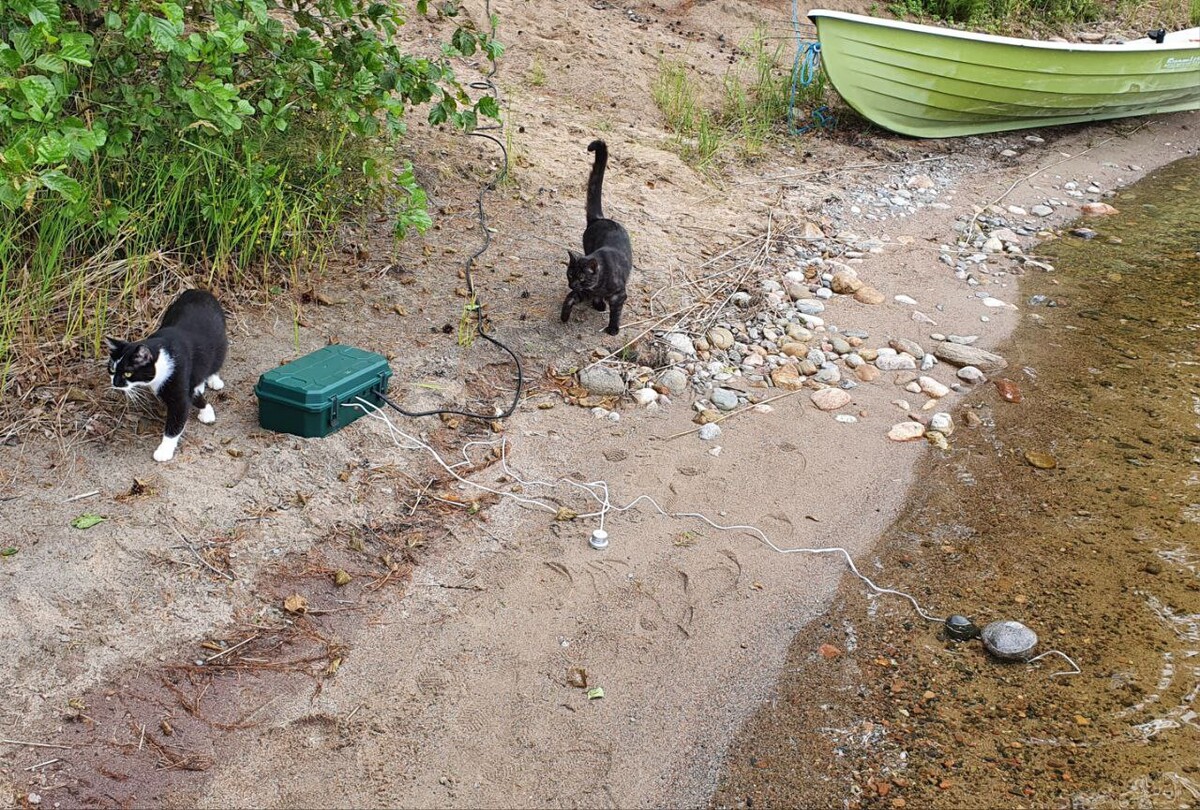
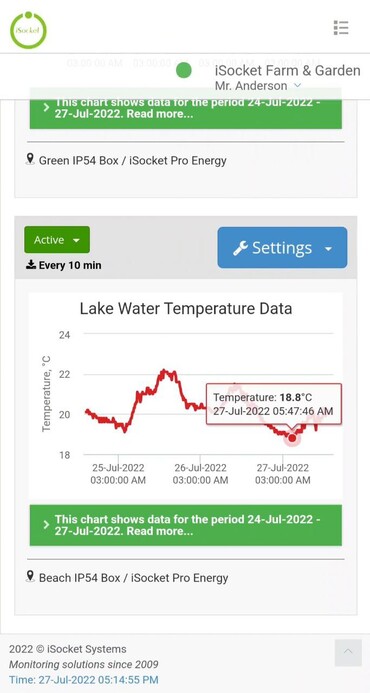
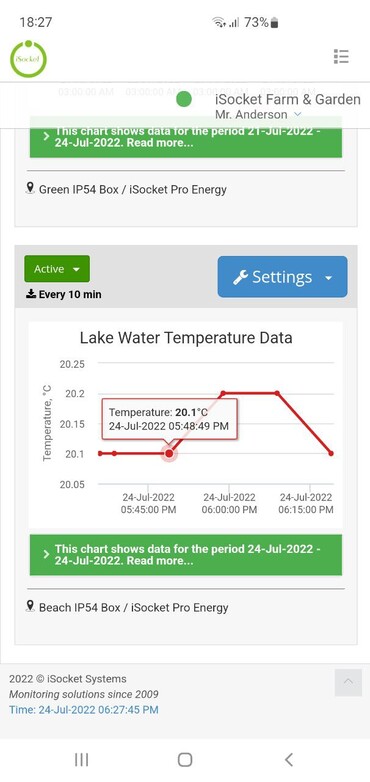
I decided to label the lake water temperature data for better clarity and visualization. The experiment spanned from late June to July, though I’m unsure of the exact starting date. What I do recall is that the data ends on July 29, and the graph begins on July 24, aligning with when I actively started the monitoring. This period provides a clear snapshot of temperature fluctuations over several days.
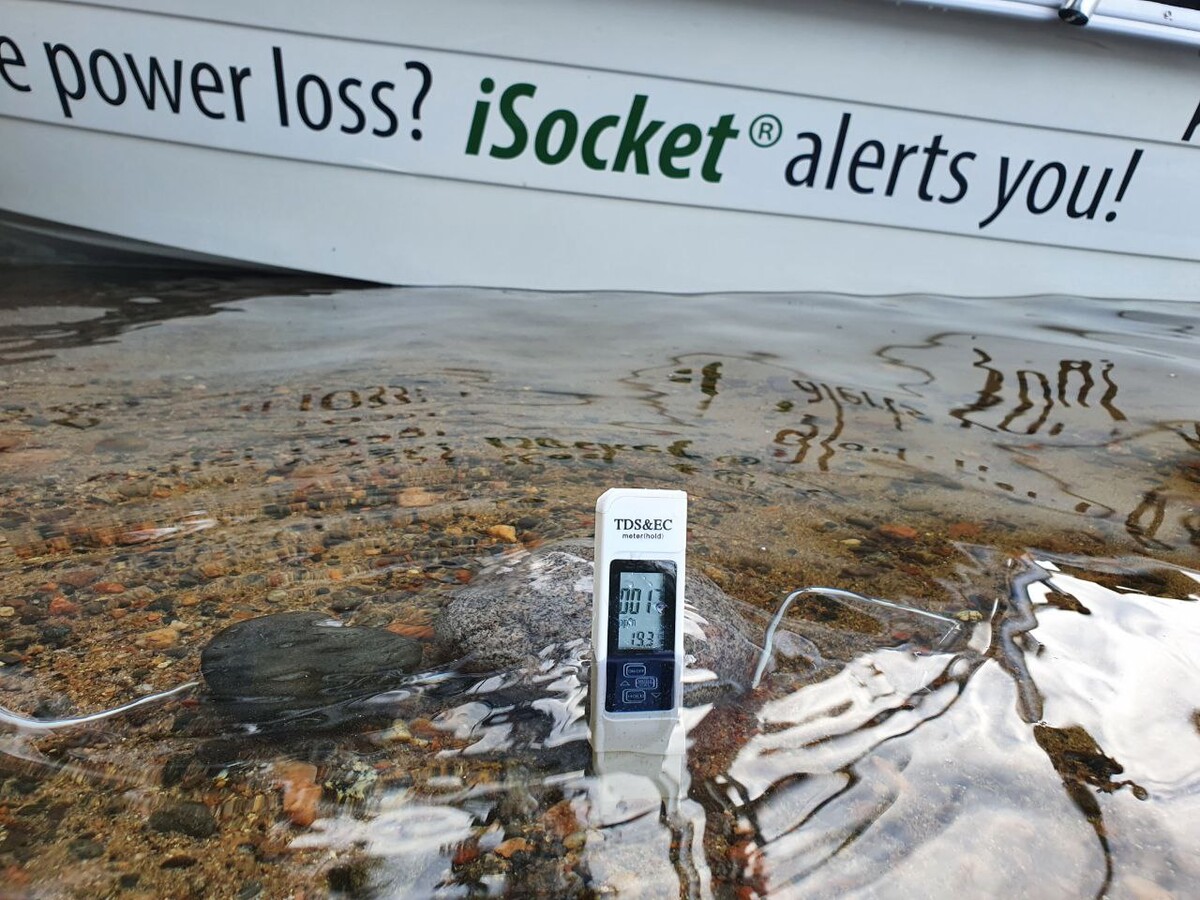
The lake temperature profile reveals an intriguing pattern, particularly the drop in temperature during the nighttime in July, even reaching as low as 16°C (60.8°F). As for a fisherman, such data is invaluable for understanding how water temperature changes might influence fish behavior. The steady rise in temperature during the day, followed by a significant drop at night, is particularly fascinating. This variation could be attributed to a cold current or some other environmental factor, though I’m not entirely certain.
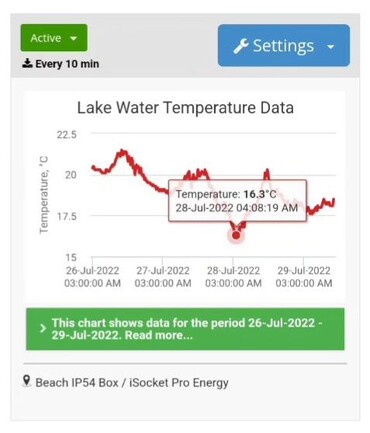
It would have been helpful to compare this data with outdoor temperatures from the same period. Unfortunately, I don’t have that information at hand, as the experiment was conducted two years ago. Despite this, the lake temperature data itself is interesting, and I’d love to hear your thoughts or suggestions on this analysis.
Las Palmas Outdoor Temperature in February
Let's move on to the outdoor temperature. I'll show you a few tricks because I use this iSocket in different locations, collecting various profiles. Right now, it's set up in Finland, but previously it was in Las Palmas. I don't remember the exact timeframe, but I’ve noted it for myself in the description:
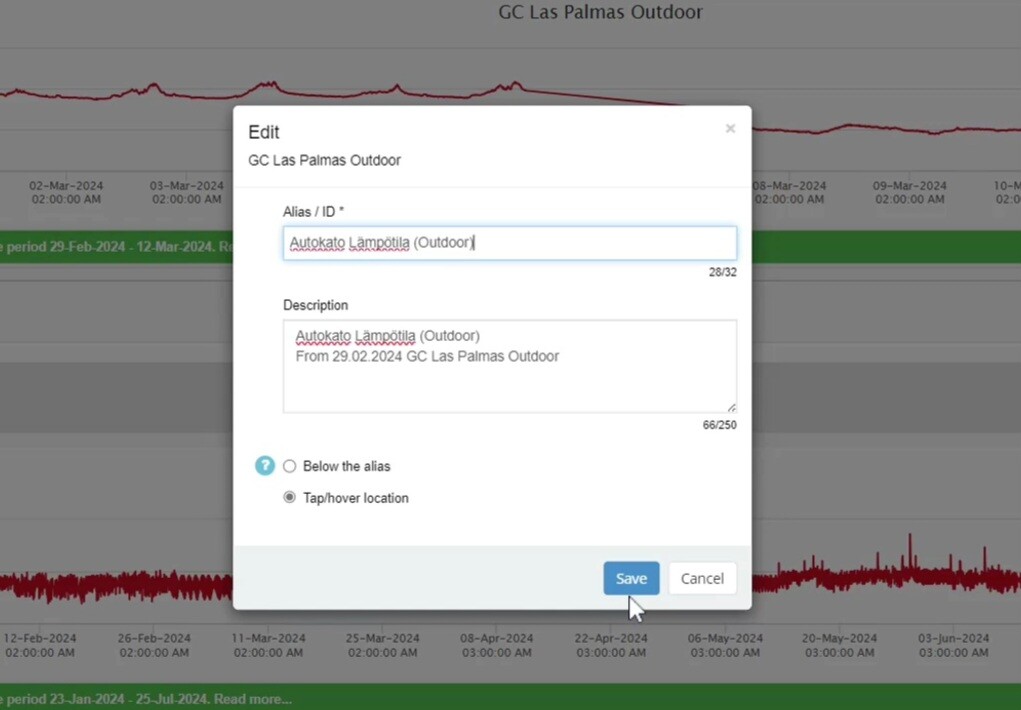
If I want to see the temperature in Las Palmas in February of this year, I just go to "View for another period" and select the right range. If you select a large time range, it may say there are too many data points, but you can choose how many to display:
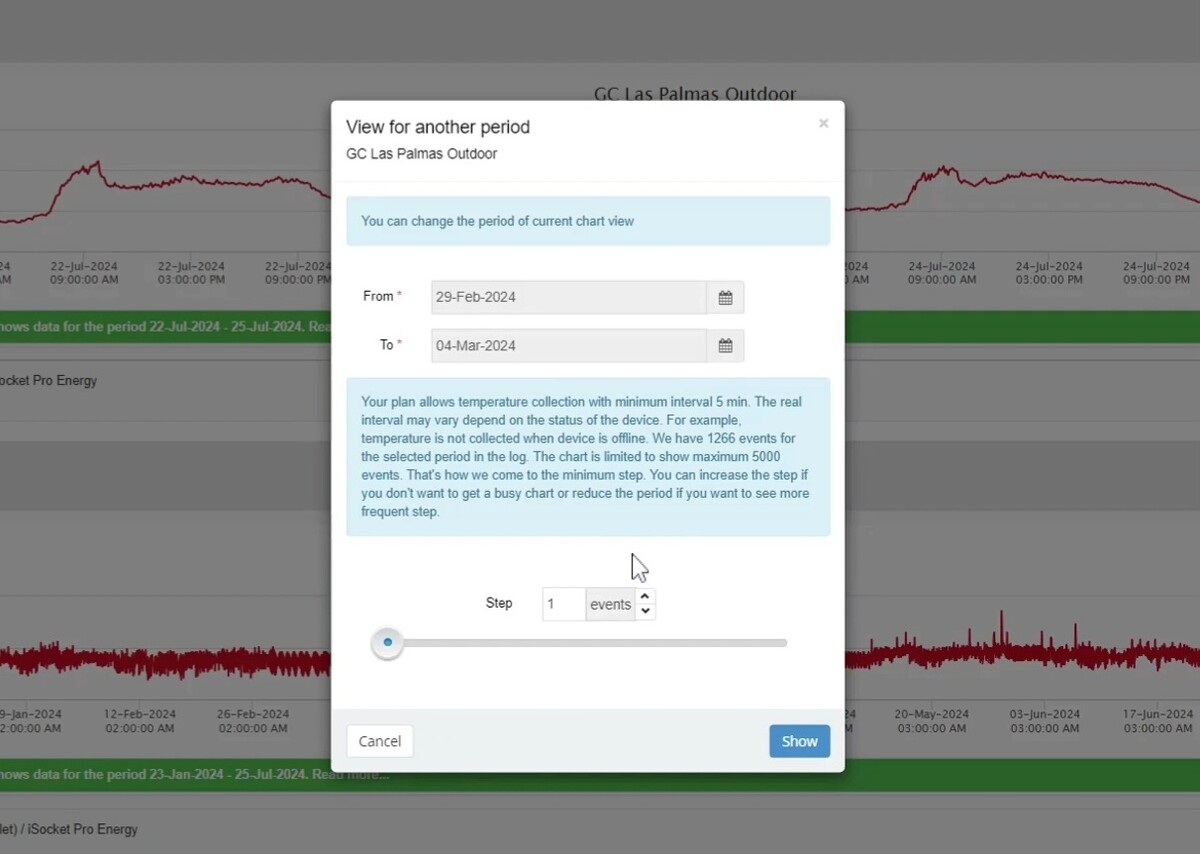
However, I won’t go into that detail right now, as we’re mainly focused on looking at different profiles.

For example, from February 29th to March 4th, the sensor was on the balcony, and you can see it was quite cold - around 19°C (66°F). During the daytime, it reached about 27°C (80°F). There’s a spike, likely from direct sunlight. At night, you can clearly see the temperature drops. This profile shows the typical fluctuations you would expect when the sensor is placed outdoors, particularly during winter months.
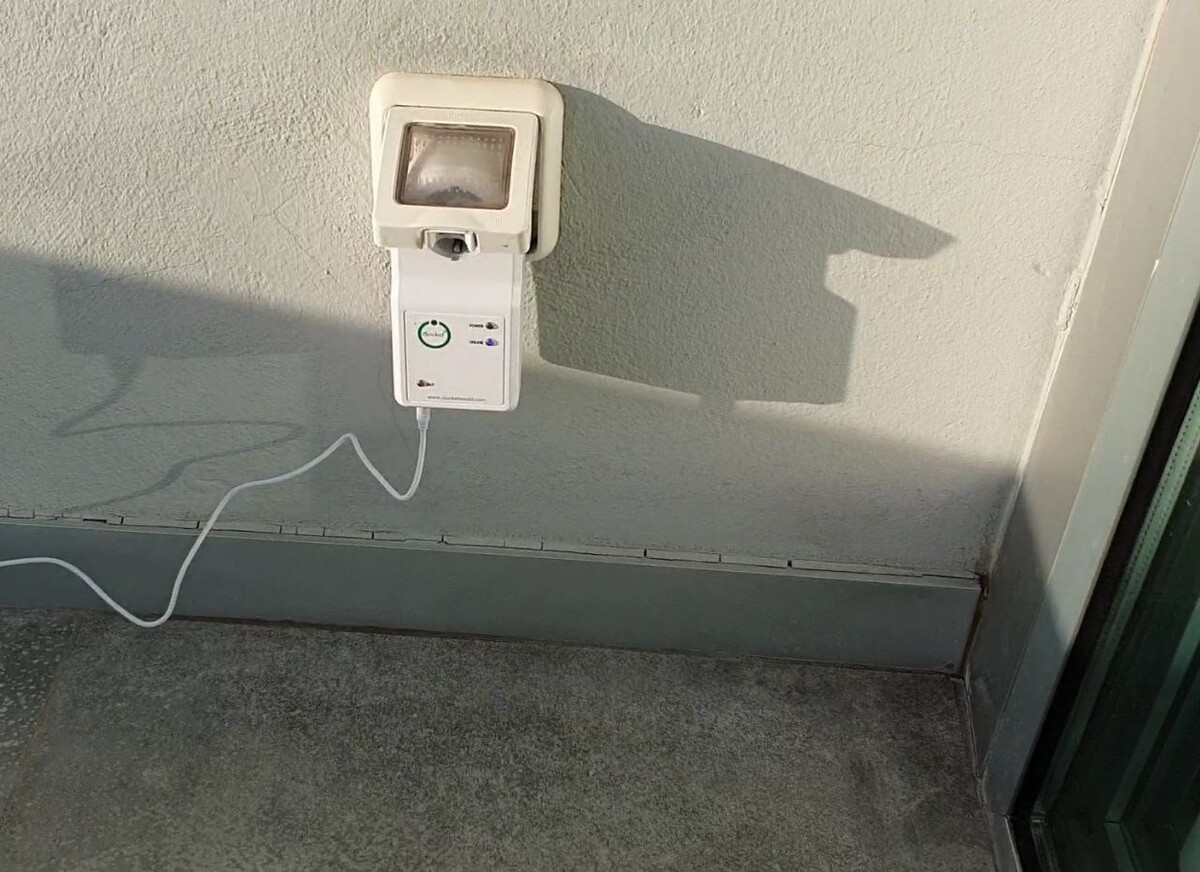
Temperature Differences in the Same Room
Here’s an interesting observation about temperature monitoring in a room. I installed two iSocket sensors in the same room, just a meter or two apart, as you can see in the photo. After collecting data, I switched to Fahrenheit for reading and analyzed the temperature profiles of both sensors for viewers from USA.
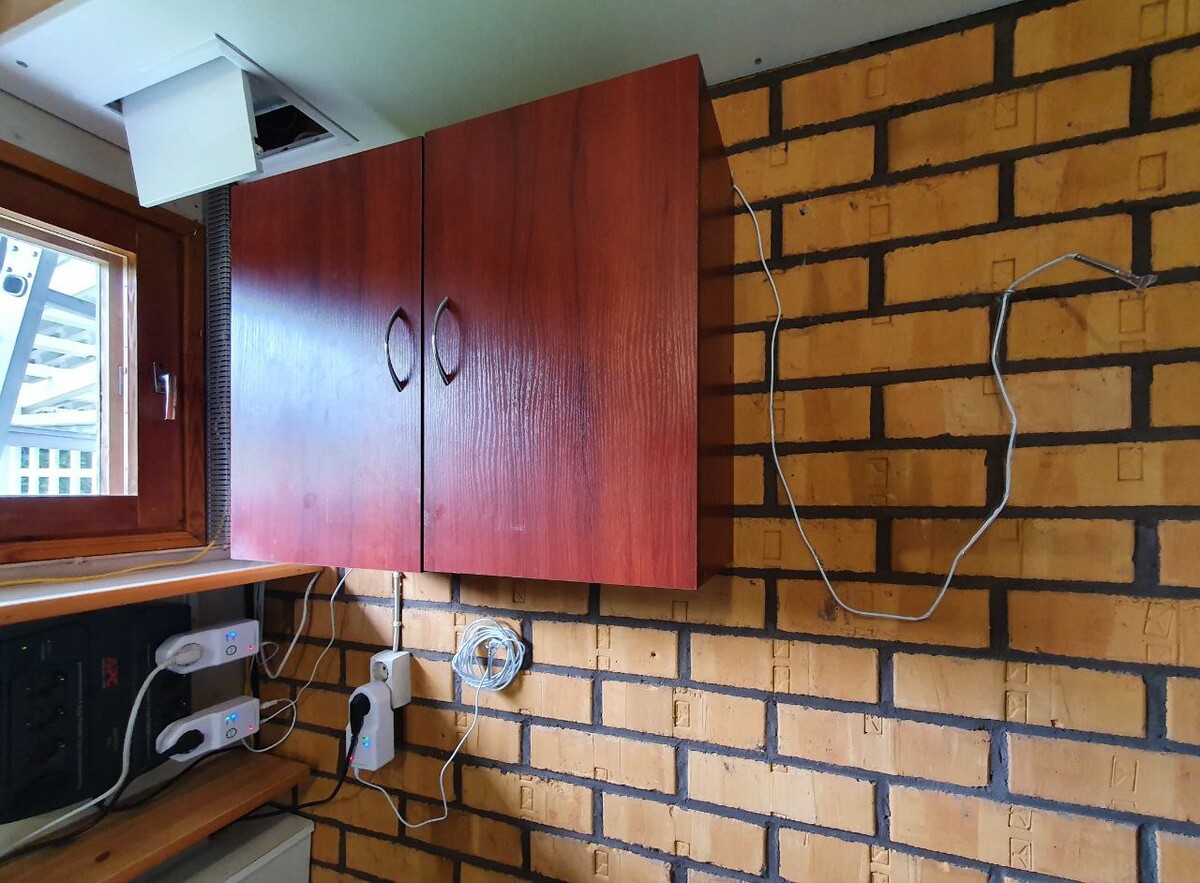
Many people believe the temperature in their homes is constant because they see a steady reading on their HVAC system or other monitoring tools, like 75-80°F. However, this isn’t always the case. Your HVAC system is often set to "fake" the temperature by averaging fluctuations, which results in a more stable reading.
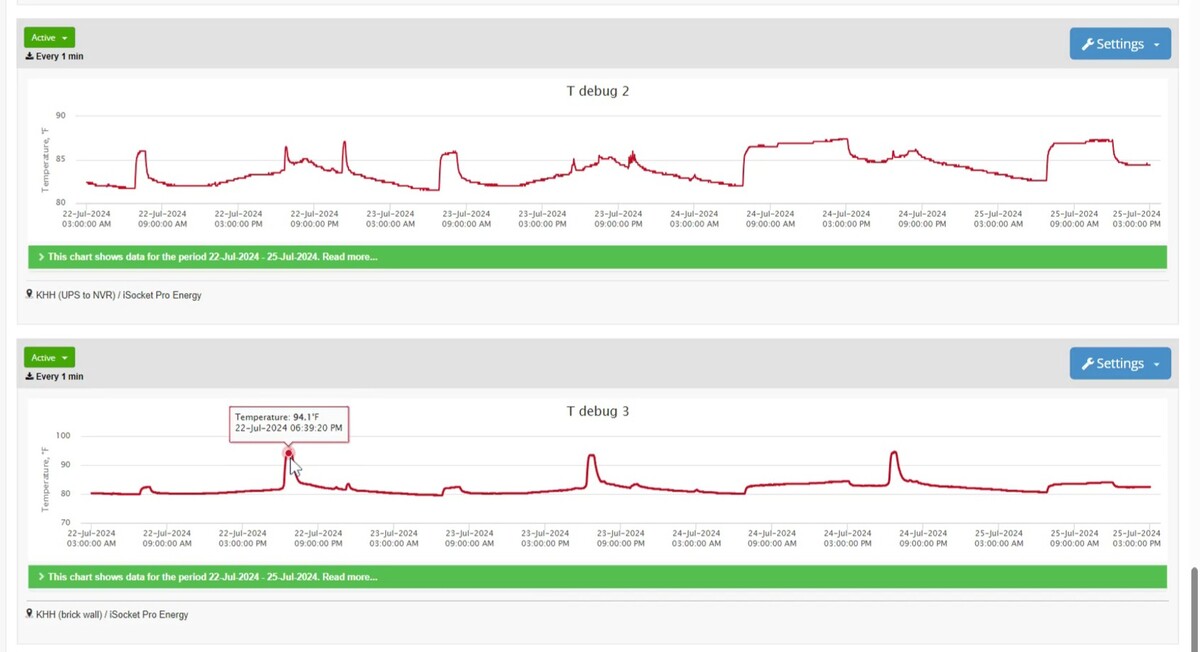
When you look at the temperature profiles from the two sensors, you’ll see several spikes. These spikes occur when sunlight shines on the window, causing the temperature to rise and fall throughout the day. Your HVAC system won’t show these fluctuations; it will smooth them out to provide a constant reading like 77°F, known as "hysteresis." But with minute-by-minute temperature collection using real sensors, you get a more accurate, true representation of how the temperature changes in your home.
This highlights the importance of using a more detailed monitoring system to truly understand the environmental changes in your space.